
Architectural visualisation reduces uncertainty, produces clearer feedback, and builds public trust by showing proposed developments accurately in their real-world context. Where written descriptions leave residents guessing, a photorealistic CGI or verified photomontage gives them something concrete to respond to. The result is consultation responses that are specific, grounded, and genuinely useful to planning officers and design teams.
Core benefits at a glance:
- Reduces ‘fear of the unknown’ by showing proposals in familiar surroundings
- Improves feedback quality from vague objection to site-specific comment
- Builds trust and transparency between developers and local communities
- Raises officer confidence in assessing visual impact
Key takeaways
Architectural visualisation is the most direct lever available to UK planning teams for improving both the reach and the quality of community consultation responses.
| Point | Details |
|---|---|
| Agree viewpoints early | Confirm required views and formats with the LPA at pre-application to avoid costly revisions. |
| Demand verification metadata | Every planning-grade photomontage needs a survey-controlled verification statement and full source data. |
| Combine digital and physical formats | Pairing interactive 3D tools with tangible printed models reaches a wider demographic, including older and younger residents. |
| Measure what changes | Track response quality, demographic spread, and officer confidence, not just response volume. |
| Visualtrick for planning-ready CGI | Visualtrick delivers verified photomontages, CGI stills, and interactive models built to UK planning submission standards. |
Table of Contents
- How does visualisation change the quality of consultation responses?
- What types of visualisation work best for UK planning consultation?
- What does UK planning practice require from visual evidence?
- What makes a visualisation planning-ready?
- How should you present visual material at events and online?
- What do the Lancaster and Wirral case studies tell us?
- What should you ask a visualisation supplier before commissioning?
- How do you measure whether visualisations improved consultation?
- The case for getting this right from the start
- Visualtrick delivers planning-ready visualisations for UK consultation
- Sources
How does visualisation change the quality of consultation responses?
Abstract proposals trigger defensive reactions. When residents cannot picture what is being built, they default to worst-case assumptions, and consultation responses reflect that anxiety rather than the actual proposal. Visual material breaks that cycle by turning a planning document into a recognisable change to a place people know.
Interactive 3D tools such as ENGAGE3D allow consultees to move through a site, switch viewpoints, and compare scenarios, which helps communities examine visual change at multiple distances. The shift from passive reading to active exploration is significant: people who can locate themselves relative to a proposal ask better questions and raise more specific concerns.
The Lancaster case study puts numbers to this. The 3D engagement app averaged 298 daily views during its first ten weeks, and training increased planning officers’ confidence in using 3D models by 40%, with 25% using the model daily. Those are not marginal gains.
CGI stills created from reliable survey data, mapping, and 3D models reduce ambiguity for both technical and lay audiences, supporting planning statements, pre-application discussions, and committee packs.
What types of visualisation work best for UK planning consultation?
The right format depends on the project stage, the audience, and what decision the visualisation needs to support.
- CGI stills: photorealistic exterior or interior images rendered from accurate 3D models. Best for printed boards, committee packs, and online image galleries where a single clear view carries the argument.
- Verified photomontages: camera-matched composites of the proposed development inserted into a real photograph from a surveyed viewpoint. Required for LVIA submissions and any context where visual impact must be defensible.
- Interactive 3D models: web-based or touchscreen viewers that let consultees explore a site freely. Highest engagement at public exhibitions and online portals; particularly effective for large or complex sites.
- VR experiences: immersive walkthroughs using headsets. Excellent for engaging younger audiences and generating media interest at pop-up events, though they require staffing and equipment.
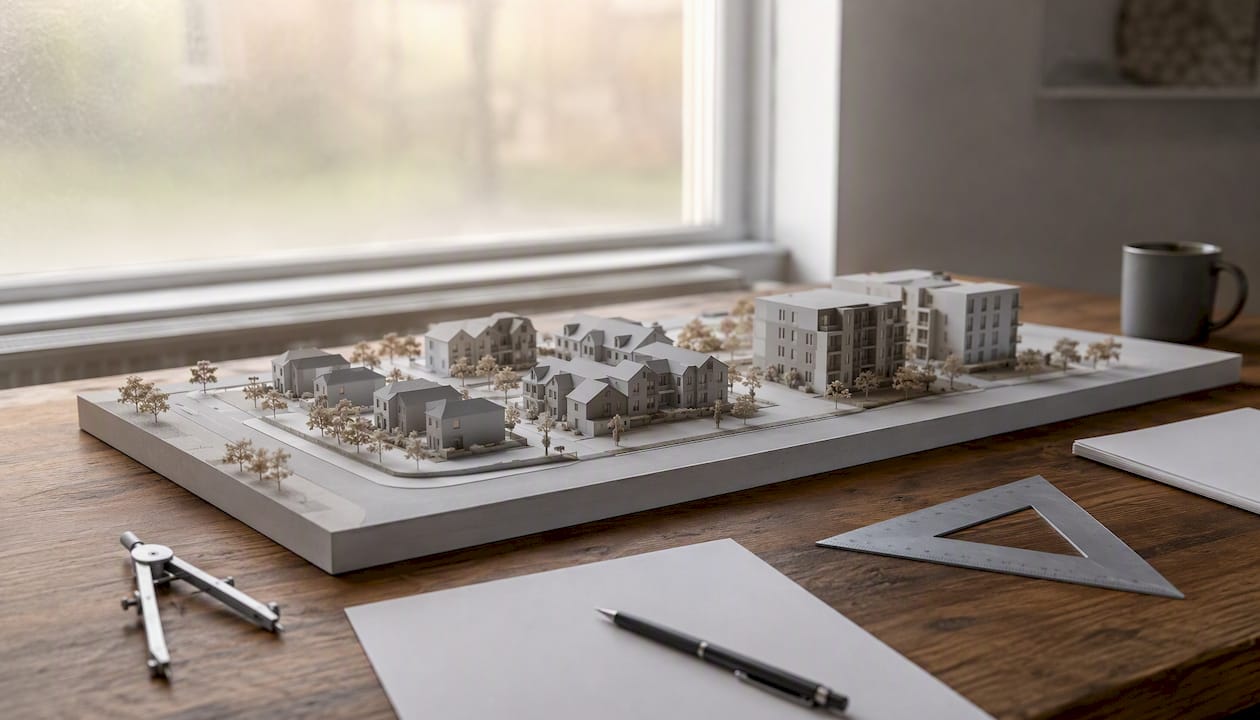
- Tangible 3D prints: physical scale models. Highly accessible for older residents and those with low digital literacy; Lancaster’s printed model proved especially effective at community events.
Visualisation acts as a shared language between professionals and non-specialists. At concept stage, lightweight 3D and photogrammetry models are enough to test reactions. Pre-submission, verified photomontages become the standard. At committee, high-fidelity CGI and interactive models carry the most weight.
What does UK planning practice require from visual evidence?
Tower Hamlets’ local validation list states that CGI visualisations are required for all major developments, and that the views required and the level of detail depend on scale, prominence, and setting sensitivity. Tower Hamlets is not unusual; most LPAs with active major-development pipelines include equivalent requirements in their validation checklists.
Viewpoint selection is almost always agreed with the local planning authority at pre-application stage. Submitting visuals from viewpoints the authority did not approve wastes everyone’s time and can delay validation.
- Confirm required viewpoints and formats in pre-application discussions
- Check the LPA’s local validation list before briefing a supplier
- Agree whether verified photomontages or CGI stills are needed for each view
- Establish whether the authority expects an interactive model for the committee stage
Pro Tip: Request a pre-application meeting agenda item specifically for viewpoint agreement. A ten-minute conversation at that stage prevents weeks of revision later.
What makes a visualisation planning-ready?
A planning-ready visual is one that can be scrutinised, replicated, and defended. Verified visual montages (VVMs) are created from defined real locations using quantifiable data, so any third party can check the veracity of the image. That auditability is what separates a planning submission from a marketing brochure.
Minimum verification requirements:
- Survey control: a licensed surveyor establishes camera position, height, and orientation to sub-centimetre accuracy
- Focal length matching: the camera’s lens parameters are recorded and replicated in the 3D render
- Terrain data: LiDAR or OS mapping provides accurate ground modelling
- Photomontage verification report: a written statement confirming methodology, data sources, and accuracy tolerances
| Data input | Purpose |
|---|---|
| LiDAR / OS terrain data | Accurate ground and topography modelling |
| Survey control points | Camera position and orientation calibration |
| Ordnance Survey mapping | Site context and surrounding built form |
| Photographic metadata (EXIF) | Lens focal length and exposure verification |
| 3D model parameterisation | Accurate massing, height, and material representation |
Pro Tip: Ask any prospective supplier to share a sample photomontage verification statement and the associated metadata before you appoint them. If they cannot produce one, the visual will not survive scrutiny at committee.
See also: how 3D models become planning images for a practical walkthrough of the process.
How should you present visual material at events and online?
The single most effective principle is context first, interaction second. Show consultees where the site sits in the wider area before zooming into the proposal. People need to locate themselves before they can form an opinion.
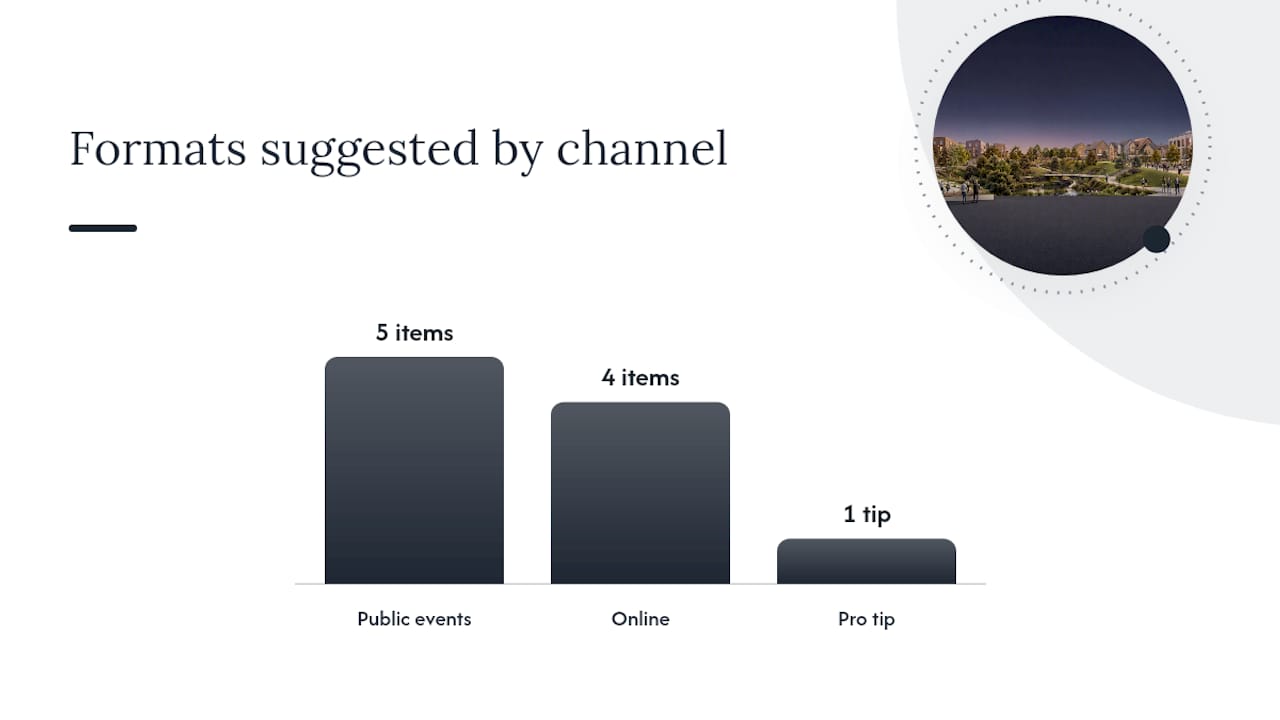
At public events:
- Open with a large-format printed context board showing the site in its neighbourhood
- Provide a touchscreen or tablet station with an interactive 3D model for self-guided exploration
- Staff the interactive station: an unanswered question at a screen becomes a vague objection on a feedback form
- Offer a tangible 3D print for visitors who find screens uncomfortable
- Run a VR pop-up for younger attendees, with a brief facilitated session
Online:
- Embed an interactive 3D viewer on the consultation portal with clear navigation prompts
- Use annotated storymaps to guide less confident users through key viewpoints in sequence; structured visual narratives help consultees follow a logical path through complex proposals
- Provide a simple image pack (JPEGs, PDF boards) for sharing via email and social media
- Caption every image with the viewpoint location and direction so feedback can be tied to a specific view
Pro Tip: Print large-format boards at A1 minimum. A3 boards at a standing exhibition are almost unreadable, and residents who cannot see the detail will not engage with the feedback form.
What do the Lancaster and Wirral case studies tell us?
Both projects demonstrate that the format of visual engagement directly determines who responds and how usefully.
Lancaster’s Historic High Streets Heritage Action Zone project combined 3D modelling, LiDAR public walks, gaming technology, and a portable 3D printed model. The 3D app averaged 298 daily views in its first ten weeks; the accompanying Storymap recorded 344 views.
Wirral Council paired a digital 3D model with a hybrid engagement strategy: school workshops, VR events, and targeted outreach. The result was a broader demographic spread of consultation responses than the authority had previously achieved through traditional methods.
Lessons for your next project:
- Combine digital and physical formats to reach different age groups simultaneously
- School workshops generate youth engagement that online portals alone cannot replicate
- Staffed VR sessions at pop-up events attract media coverage and younger participants
- A Storymap or guided online viewer extends the reach of a one-day exhibition for weeks
What should you ask a visualisation supplier before commissioning?
The single most important question is: “Can you supply a planning-grade photomontage verification statement and full metadata for each viewpoint?” If the answer is uncertain, the deliverable is not planning-ready.
Commissioning checklist:
- Confirmed deliverable list (number of views, formats, resolution)
- Photomontage verification report included as standard
- Source data provenance (LiDAR, OS mapping, survey control)
- File formats: native 3D model files, layered PSD or TIFF, PDF boards
- Interactivity scope: web viewer, touchscreen app, or static images only
- Hosting or file transfer method and duration
- Copyright and licensing terms (who owns the model and images)
- Number of included revision rounds and cost of additional rounds
- Timescale from survey to final deliverable
- Rush delivery policy and associated cost
Cost drivers to understand:
- Model fidelity and surrounding context detail
- Number of verified viewpoints requiring survey
- LiDAR or topographic survey costs (often a separate line item)
- Interactivity development and hosting
- Rush or phased delivery
| Output level | Typical deliverables | Key cost drivers |
|---|---|---|
| Concept | Massing CGI stills, context boards | Model complexity, number of views |
| Planning submission | Verified photomontages, verification report, layered files | Survey costs, viewpoint count, LiDAR data |
| Committee-ready | High-fidelity CGI, interactive 3D viewer, presentation boards | Interactivity development, hosting, model detail |
For a detailed look at how CGI supports planning applications, including what to include in a brief, see Visualtrick’s planning CGI guide.
How do you measure whether visualisations improved consultation?
Measuring impact closes the loop between investment and outcome. Track these KPIs:
- Response volume: total number of consultation responses received
- Response quality: proportion of responses referencing specific views, distances, or design elements
- Demographic spread: age and postcode distribution of respondents versus previous consultations
- Online engagement: viewer sessions, average time on interactive model, Storymap page views
- Officer confidence: pre/post survey of planning officers on their understanding of the proposal
- Vague objection rate: proportion of responses that raise concerns without referencing the proposal specifically
- Speed to determination: whether richer consultation material shortened the officer assessment period
Gather event tallies on the day, pull web analytics weekly during the consultation window, and code feedback forms to distinguish site-specific comments from generic ones.
The case for getting this right from the start
The planning system rewards preparation. Developers and planning consultants who treat visualisation as a last-minute box-tick consistently produce material that neither satisfies LPA validation requirements nor generates the quality of community response that supports a smooth determination. The evidence from Lancaster and Wirral is unambiguous: when people can see a proposal clearly, they engage with it on its merits rather than their fears.
What I see repeatedly is that the gap between a difficult consultation and a productive one is rarely the proposal itself. It is almost always the quality and timing of the visual material. Commissioners who agree viewpoints at pre-application, invest in survey-controlled photomontages, and pair digital tools with physical formats at events consistently report clearer feedback and fewer late-stage objections. The pre-application conversation with the LPA about required views is the single step most often skipped, and it is the one that costs the most time when it is missed.
Visualtrick delivers planning-ready visualisations for UK consultation
Visualtrick produces architectural visualisations built to planning-grade accuracy: verified photomontages with full survey control and verification statements, photorealistic CGI stills for committee packs and printed boards, and interactive 3D models for public exhibitions and online portals.
Services relevant to community consultation include planning CGI, verified photomontage, interactive 3D viewers, print-ready exhibition boards, and event support. Every deliverable comes with the source data, metadata, and file formats your planning consultant needs to submit with confidence. Contact Visualtrick for a project checklist or to request sample deliverables tailored to your scheme.
Sources
- Verified photomontage illustrations in LVIAs
- Using 3D modelling to transform public engagement in Lancaster
- LUC launches ENGAGE3D for infrastructure consultations
- CGI Visualisations — Local validation list (Tower Hamlets)
