
Presenting planning arguments visually step by step is the practice of building a hierarchical logical structure, known formally as argument mapping, and then applying visual rhetoric to guide your audience through every claim, premise, and rebuttal. The technique reduces cognitive load, exposes hidden assumptions, and makes complex development proposals far easier for decision-makers to follow. Planners and development professionals who adopt this method consistently produce clearer, more persuasive submissions than those who rely on dense written reports alone. This guide walks you through the complete process, from gathering your tools to refining your final visual for a planning committee or public inquiry.
What do you need before presenting planning arguments visually step by step?
Preparation determines whether your visual argument lands or collapses under scrutiny. Before you build a single diagram, you need three things in place: the right tools, the right materials, and a clear understanding of your audience.
Tools and templates
Diagramming software that supports hierarchical node layouts is the foundation of any argument map. Free and paid options exist across a wide range, from browser-based diagramming tools to dedicated argument mapping platforms. Whichever you choose, confirm it supports colour coding, because colour-coded objections and rebuttals are central to the method. You also need a typography guide and a colour palette that meets accessibility contrast standards.
- Diagramming software with hierarchical node support
- Argument mapping templates that separate premises, evidence, and objections into discrete boxes
- A colour coding guide assigning consistent colours to claims, support, objections, and rebuttals
- A typography standard covering font size, weight, and line spacing for on-screen and printed output
Materials and evidence
Your argument map is only as strong as the evidence behind it. Gather concise textual summaries of each supporting point, relevant data from transport assessments, heritage reports, or ecological surveys, and any expert testimony you intend to cite. Anticipate the objections a planning officer or inspector is likely to raise, and collect counter-evidence before you start mapping. Starting with a narrative structure oriented by audience and goal, before addressing technical detail, is the most reliable way to avoid building a map that answers questions nobody asked.
Audience and purpose
A planning committee needs a different level of complexity than a specialist design review panel. Identify whether your audience is technical or lay, adversarial or neutral, and calibrate the depth of your map accordingly. A lay audience benefits from fewer branches and more contextual imagery. A specialist audience can absorb more premise layers but will scrutinise logical links far more closely.
Pro Tip: Build two versions of your map: a full technical version for the planning file and a simplified summary version for committee presentations. The summary version should contain no more than three levels of hierarchy.
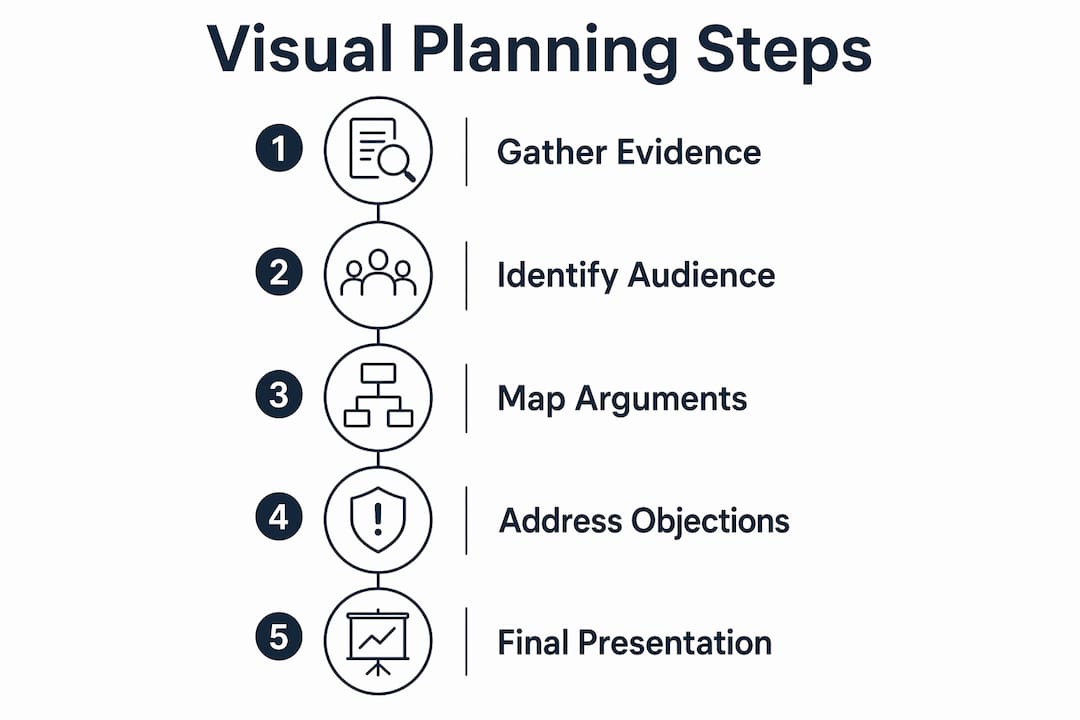
How do you build a visual planning argument map?
A disciplined six-step process covers everything from formulating your conclusion to mapping rebuttals. Each step builds directly on the last, so skipping ahead creates logical gaps that experienced inspectors will find immediately.
-
Formulate a single, precise main claim. Write one sentence that states exactly what you are arguing. For example: “The proposed residential development at this brownfield site is acceptable in planning terms because it meets the requirements of the National Planning Policy Framework.” One claim per map. Two claims require two maps.
-
Identify and classify your primary reasons. List every reason that supports your main claim. Then test each reason: does it stand alone, or does it only work when combined with another reason? Co-premises must be linked because they depend on each other to support the claim. Independent premises each get their own branch. Any sentence containing “and” almost certainly needs splitting into two separate nodes.
-
Link robust evidence to each premise. Attach data, studies, or expert testimony directly to the premise it supports. A transport assessment figure belongs under the transport premise, not floating at the top of the map. This keeps logical chains visible and auditable.
-
Map counter-arguments and rebuttals explicitly. Colour objections in red and rebuttals in yellow to make the intellectual honesty of your argument visible at a glance. Ignoring objections does not make them disappear. Mapping them with prepared rebuttals demonstrates that your argument survives challenge. Incorporating devil’s advocate perspectives with explicit rebuttals pre-empts the questions a planning inspector will ask.
-
Apply visual hierarchy and alignment. Place your main claim at the top or far left. Primary premises occupy the next level. Evidence and rebuttals sit below or to the right. Consistent alignment signals logical order to the viewer before they read a single word.
-
Refine with colour coding and spacing. Use your pre-agreed colour palette. Add white space between nodes. Remove any text block longer than two sentences from a single node.
Pro Tip: After completing your map, cover the text and ask a colleague to describe the argument structure from the visual layout alone. If they cannot, your hierarchy needs simplifying.
How does visual rhetoric strengthen a planning argument?

Visual rhetoric is the deliberate use of design choices to guide how an audience interprets information. Every design element, including typography, colour, and layout, acts as a rhetorical device directing the viewer toward your intended conclusion. This is not decoration. It is argument by design.
The most effective planning presentations combine statistical charts with emotional or contextual imagery rather than relying on text alone. A bar chart showing housing need figures carries more weight when placed alongside a photomontage of the proposed scheme in context. The chart addresses the logical argument; the image addresses the human one. Both are necessary.
“Visual rhetoric requires ‘thick representation’ where visuals select, organise, and emphasise data for persuasion rather than mere decoration. High-stakes planning visuals should comprise at least 50% of content to avoid audience fatigue and maximise impact.”
Practical design choices that function as rhetorical devices include:
- Typography weight: Bold headings on your main claim signal its primacy before the audience reads supporting text.
- Colour saturation: High-saturation colours on key evidence nodes draw the eye to your strongest points first.
- Layout direction: Left-to-right flow mirrors natural reading direction and implies logical progression.
- White space: Generous spacing around your main claim isolates it visually, reinforcing its importance.
- Image placement: Contextual photography or CGI placed adjacent to data nodes bridges the gap between statistics and lived experience.
Website storytelling techniques from digital communication confirm that image selection and layout influence how audiences process and retain arguments. The same principles apply directly to planning presentations. A cluttered slide with eight bullet points and a small chart loses the audience within seconds. A single premise node with one supporting image and two data points holds attention and communicates clearly.
What are the most common mistakes in visual planning presentations?
Dense text, unclear logical links, neglected objections, and poor colour contrast are the four mistakes that appear most often in planning argument visuals. Each one has a specific fix.
Visual planning is not brainstorming. Professionals who treat argument mapping as a mind-mapping exercise produce unfocused visuals with no clear logical chain. The distinction matters because a planning inspector reads your map as a logical document, not a creative one.
Best practices to adopt:
- Iterate before presenting. Show your map to a planning colleague who was not involved in building it. Ask them to identify the main claim, the three strongest premises, and one objection. If they struggle, revise.
- Layer complexity with expandable sections. For digital presentations, use scroll-snap sections and detail cards to reveal evidence progressively rather than displaying everything at once.
- Tailor depth to expertise. A lay planning committee needs three premise levels maximum. A specialist inspector can follow five, but only if each level is clearly labelled.
- Test colour contrast. Every colour pairing in your map must meet WCAG AA contrast standards. Poor contrast is the single fastest way to lose credibility with an accessibility-conscious audience.
- Never omit objections. A map with no red branches signals to any experienced reader that you have not tested your own argument.
Pro Tip: Run your final presentation through a greyscale filter before submitting. If the logical hierarchy disappears without colour, your layout is doing too little work and your colour coding is doing too much.
Key takeaways
Presenting planning arguments visually step by step requires a hierarchical argument map, deliberate visual rhetoric, and explicit treatment of objections to produce a presentation that is both logically sound and persuasive.
| Point | Details |
|---|---|
| Start with one precise claim | A single main claim per map prevents logical drift and keeps the argument auditable. |
| Classify premises before mapping | Distinguishing co-premises from independent premises avoids weakening the logical chain. |
| Map objections explicitly | Colour-coded objections and rebuttals demonstrate intellectual honesty and pre-empt scrutiny. |
| Apply visual rhetoric deliberately | Typography, colour, and layout each carry rhetorical weight and must be chosen with intent. |
| Iterate and test with peers | Peer review before submission catches logical gaps and design failures that self-review misses. |
Why visual argument maps changed how I approach planning presentations
I have reviewed hundreds of planning submissions over the years, and the ones that fail almost never fail on the merits of the underlying proposal. They fail because the argument is buried. A planning officer reading a 40-page statement has to reconstruct the logical structure themselves. Most do not have the time, and the argument loses force before it is ever considered.
The first time I built a proper argument map for a contested residential scheme, the planning committee chair told me it was the clearest presentation she had seen in three years of committee work. That was not because the proposal was simple. It was because the map made the reasoning visible. Every premise was labelled. Every objection had a rebuttal. The committee could see the argument, not just read about it.
The challenge I see most often is the reluctance to map objections. Planners worry that showing counter-arguments weakens their case. The opposite is true. Visual maps expose unstated assumptions and create a shared mental space for collaborative clarity. When you map an objection and rebut it confidently, you demonstrate that your argument has been tested. That builds trust with decision-makers far more effectively than a polished presentation that ignores the hard questions.
The tools available in 2026 make this process more accessible than ever. Interactive digital formats allow you to layer complexity without overwhelming a lay audience. But the tool is secondary. The discipline of hierarchical logical thinking is what produces a persuasive argument. The visual layer makes that thinking legible.
— Paride
How Visualtrick’s visuals support your planning argument
Planning arguments are only as persuasive as the visuals that carry them. Committees and inspectors respond to images that are accurate, contextual, and clearly produced to a professional standard.
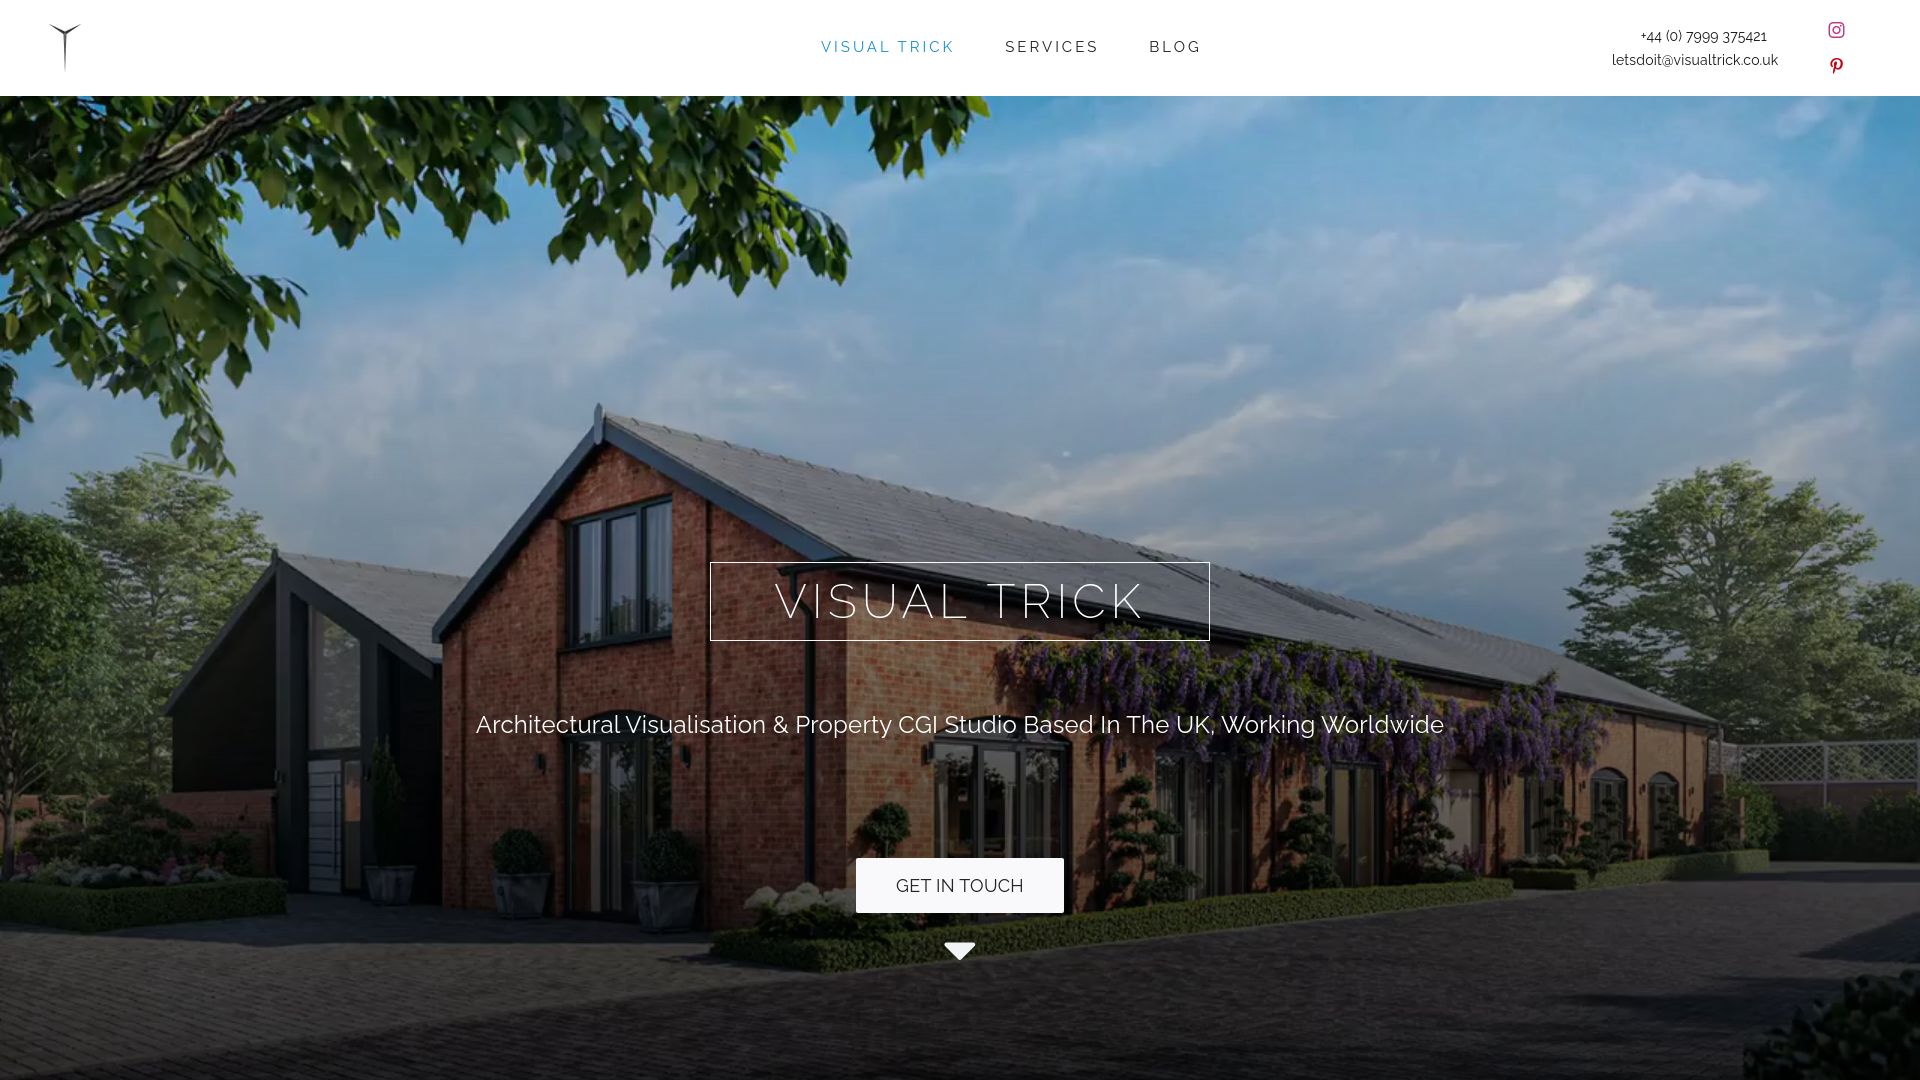
Visualtrick produces planning-grade CGI and visualisations specifically designed to support development proposals at every stage, from pre-application through to public inquiry. The images are built to sit inside argument maps and presentation decks as evidence nodes, not decoration. For architects and developers who need visuals that hold up under technical scrutiny, Visualtrick’s architectural visualisation services deliver photorealistic renders, photomontages, and contextual views that strengthen the logical and rhetorical force of any planning submission. Contact Visualtrick to discuss your next planning application.
FAQ
What is argument mapping in planning presentations?
Argument mapping is a hierarchical visual method that structures a planning case into a main claim, supporting premises, evidence, objections, and rebuttals. It makes the logical chain of a planning argument visible and auditable.
How do co-premises differ from independent premises?
Co-premises are linked claims that only support the main argument when combined. Independent premises each stand alone. Misclassifying them weakens the logical structure of your argument map.
Why should objections be included in a visual planning argument?
Mapping objections in red with corresponding rebuttals demonstrates that your argument has been tested against challenge. It builds credibility with planning officers and inspectors who expect rigorous reasoning.
What proportion of a planning presentation should be visual content?
Visuals should comprise at least 50% of a planning presentation to reduce audience fatigue and maximise persuasive impact. Text blocks within individual nodes should be limited to two to three sentences.
How do I tailor a visual argument map for a lay planning committee?
Limit the map to three levels of hierarchy and use contextual imagery alongside data nodes. Avoid technical jargon in node labels and test the map with a non-specialist colleague before the committee meeting.
