
What planning visualisation means and why it matters
Planning visualisation is the practice of representing proposed developments visually so that planners, decision-makers, and the public can understand what is being built, where, and to what effect. It goes well beyond producing attractive images. The goal is to communicate design intent, contextual impact, and spatial relationships in a form that anyone can engage with, not just those who can read technical drawings.
The industry term most practitioners use is “visual representation,” as defined within the Landscape Institute’s GLVIA3 framework. GLVIA3 establishes the principle of proportionality: choose the type and level of detail that genuinely suits the project’s scale, sensitivity, and purpose, rather than defaulting to the most elaborate option available.
Core components of planning visualisation include:
- Visual clarity: the image must represent the proposal broadly as people would perceive it in reality
- Contextual representation: the development is shown within its actual surroundings, not in isolation
- Stakeholder appropriateness: the format and detail level must suit the intended audience, whether a planning officer, a local resident, or an investor
- Proportionality: the sophistication of the visual should match the magnitude and sensitivity of the proposed change
- Purpose alignment: every image should answer a specific question, such as what will be visible, how much will change, or whether the design fits its context
Visualtrick produces planning-grade visuals that meet these standards for UK and international applications, from early concept sketches through to formal submission imagery.
Why planning visualisation is vital in urban and architectural processes
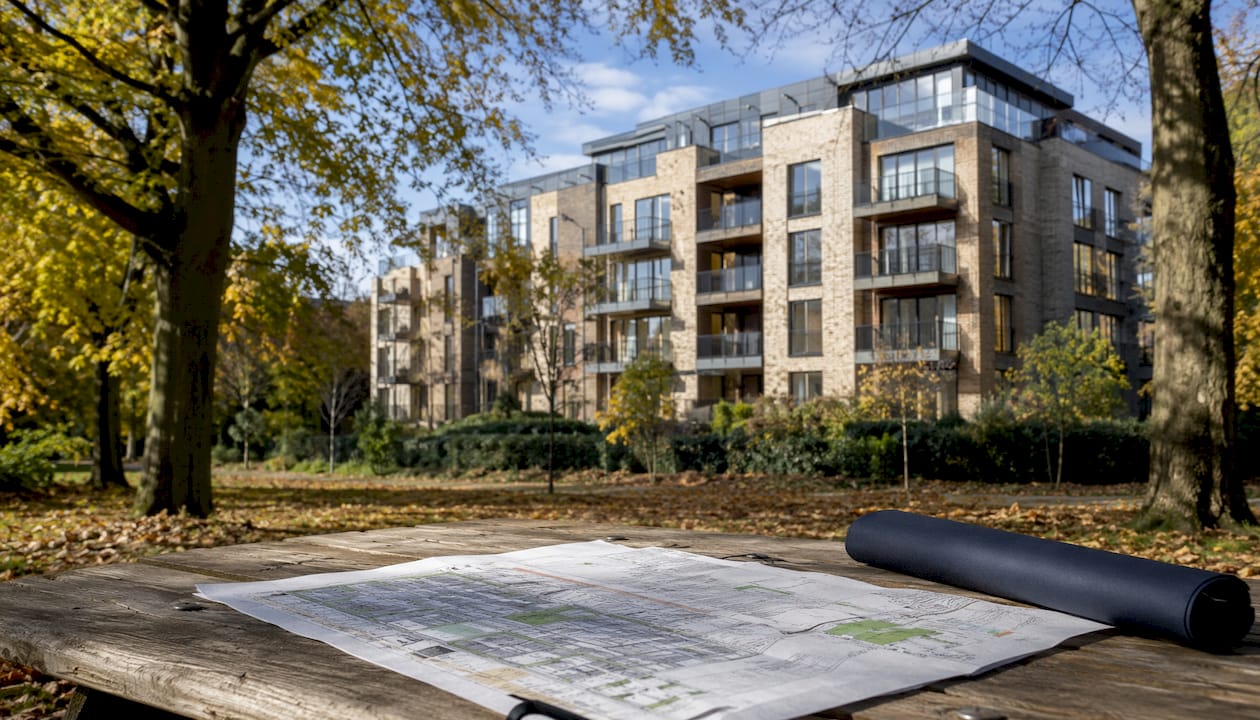
Modern planning visualisation has shifted its focus from showing solely what a development looks like to explaining how it functions and what impact it will have on its context. That shift matters because planning decisions affect communities for decades, and those communities deserve to understand proposals in full, not just their surface appearance.
Technical reports, design statements, and planning policy documents are rarely accessible to non-specialists. Visualisation converts that dense material into something a resident can engage with at a public consultation event. The result is better feedback, fewer misunderstandings, and a more constructive dialogue between applicants and the communities they are building within.
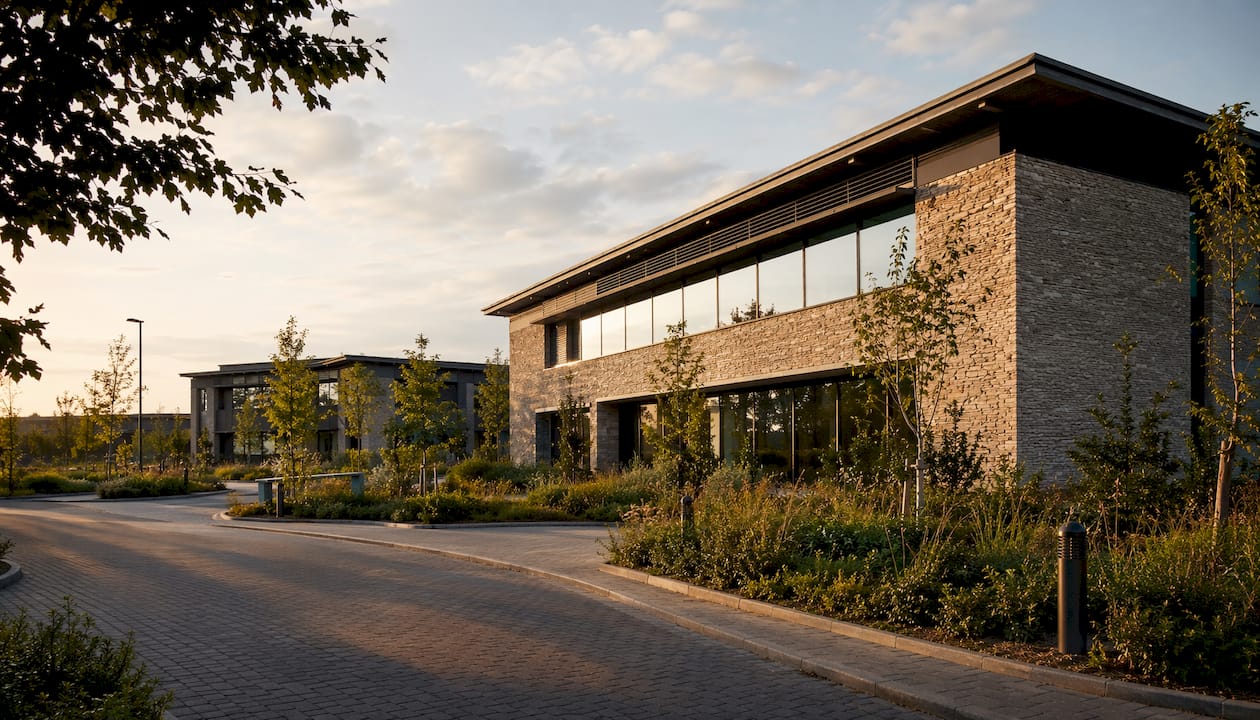
Visualisation also supports the planners and designers themselves. Seeing a proposal rendered within its real context often reveals whether a scheme is in character with its surroundings long before a formal application is submitted. That early clarity reduces the risk of inappropriate design reaching the planning committee stage.
The role of visualisation in public realm design is particularly pronounced in urban contexts, where proposals sit within complex, layered environments and affect many different groups simultaneously.
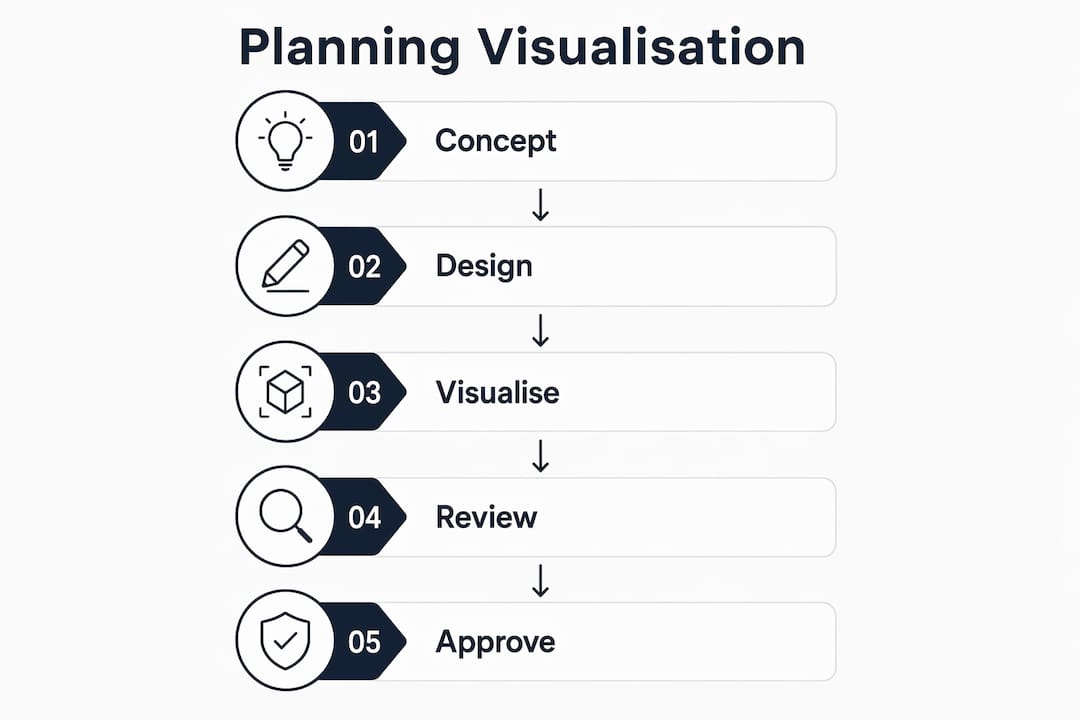
What types of visual tools do planning consultancies use?
Visualisation types should be matched to project stages, ranging from freehand sketches in early phases to photorealistic Verified Views for finalised applications. The GLVIA3 proportionality principle guides that selection, with purpose, sensitivity, and magnitude all feeding into the choice.
Common techniques include:
- Freehand sketches and concept drawings: quick to produce, ideal for early design discussions where the brief is still evolving and no fixed decisions have been made
- Plans, elevations, and sections: standard two-dimensional drawings used throughout the design process to communicate scale, layout, and relationship to adjacent structures
- Annotated photographs: a photograph of the existing view, often panoramic, with overlaid annotations showing the approximate form, scale, and location of the proposed development
- GIS-based scenario planning tools: GIS-based tools combine scenario analysis, 3D visualisation, and forecasting models to demonstrate how alternative proposals affect land use and transport patterns over time
- 3D models and massing studies: digital or physical models that communicate the volume and relationship of a scheme to its surroundings without committing to material or finish detail
- Photomontages: composite images that place a rendered proposal into a real photograph of the site, showing the development as it would appear from a specific viewpoint
- Verified Views: the most technically rigorous form of photomontage, produced to a defined methodology that ensures geometric accuracy and is accepted by local planning authorities for formal submissions
Pro Tip: Match the visual type to the question being asked. A Verified View is the right tool for demonstrating impact from a sensitive viewpoint; a sketch is the right tool for testing massing in a design workshop. Using a photorealistic CGI at the concept stage can mislead stakeholders into thinking the design is settled when it is not.
How does planning visualisation benefit stakeholders and public engagement?
Visualisation transforms planning proposals from abstract data and dense text into tangible, understandable formats, which directly improves the quality of public participation. When residents can see what is actually proposed, rather than trying to interpret a technical drawing, their feedback becomes more specific and more useful.
The benefits for stakeholders are concrete:
- Increased transparency: clear, honest imagery signals that the applicant has nothing to hide, which builds goodwill before a single objection is raised
- Better quality feedback: people respond to what they can see; visualisation draws out comments on design, scale, and character rather than blanket opposition rooted in uncertainty
- Faster approvals: proposals that are well communicated tend to generate fewer requests for further information from planning officers
- Reduced opposition: collaborative and live visualisations that involve stakeholders early allow concerns to be addressed before they harden into formal objections
- Greater inclusivity: visualisation helps people who are not fluent in planning language to participate meaningfully in decisions that affect their neighbourhood
- Trust building: when a proposal shows clear and understandable information, it invites constructive feedback rather than defensive reactions
Understanding how data translates into decisions is relevant here too. The same principle that makes data visualisation effective in research contexts applies in planning: the clearer the presentation, the more confident and informed the audience’s response.
UK expert insights and best practices for impactful planning visualisation
The most common mistake in planning visualisation is producing imagery that is too detailed, too early. Over-visualising at early project stages with highly detailed CGI can mislead the public into thinking designs are final, generating feedback that fixates on surface details rather than the fundamental questions of use, scale, and fit.
The Landscape Institute’s GLVIA3 framework provides a structured approach: identify the purpose and intended user of the visualisation, assess the magnitude of the proposed change, consider the sensitivity of the visual context, and then select the appropriate type. That process protects both the applicant and the community from imagery that misleads rather than informs.
Visualtrick aligns its architectural visualisation services with these principles, producing visuals calibrated to the stage of the project and the needs of the audience. For formal planning applications, that means Verified Views produced to the required methodology. For early engagement, it means concept imagery that communicates intent without implying finality.
Pro Tip: Involve your visualisation specialist at the pre-application stage, not just when the design is complete. Early input on viewpoint selection, visual sensitivity, and appropriate image types can prevent costly revisions later in the process.
Collaborative approaches, where visualisations are developed iteratively with stakeholder input, consistently produce better outcomes than presenting a finished image for comment. Live feedback loops allow adjustments to be made while the design is still fluid, which is far more productive than defending a fixed scheme against entrenched opposition.
Examples of effective planning visualisation in practice
Effective planning visualisation tends to share a few characteristics regardless of project type: the right level of detail for the stage, a genuine representation of the context, and a clear answer to the question the image is meant to address.
A residential scheme in a sensitive townscape context might progress through three distinct visual stages. Early massing models establish whether the proposed height and footprint are appropriate before any architectural detail is committed to. Photomontages at the pre-application stage show the scheme within its real street context, allowing planning officers to assess character and scale. Verified Views then accompany the formal application, providing the geometric accuracy that local planning authorities require for decision-making.
Healthcare and care sector developments follow a similar logic. Visualisation in hospital planning must communicate not only what a building looks like but how it relates to its clinical and community context, which demands a different visual vocabulary than a residential scheme. Visualtrick has produced planning-grade imagery across both sectors, with visuals that meet regulatory requirements while remaining accessible to lay audiences.
Large infrastructure and transport projects use GIS-based scenario tools to compare alternative alignments and demonstrate cumulative impacts across a region. That kind of dynamic, data-driven visualisation goes well beyond a single rendered image; it allows stakeholders to interrogate different futures rather than simply react to one fixed proposal.
The consistent thread across all these examples is that the visualisation serves the decision, not the other way around.
Key takeaways
Planning visualisation is the practice of representing proposals visually so that all stakeholders, from planning officers to local residents, can engage with what is genuinely proposed and make informed decisions.
| Point | Details |
|---|---|
| Definition | Planning visualisation communicates design intent and contextual impact in a form accessible to non-specialists. |
| GLVIA3 proportionality | The Landscape Institute’s GLVIA3 framework guides selection of visual type based on purpose, sensitivity, and magnitude. |
| Stage-matched visuals | Sketches suit early design; photomontages support pre-application; Verified Views are required for formal submissions. |
| Stakeholder benefits | Clear imagery builds trust, improves feedback quality, and can reduce opposition before it becomes entrenched. |
| Common pitfall | Over-detailed CGI at early stages misleads stakeholders into treating provisional designs as final decisions. |
